 Hardware Ready Ready to Bench?
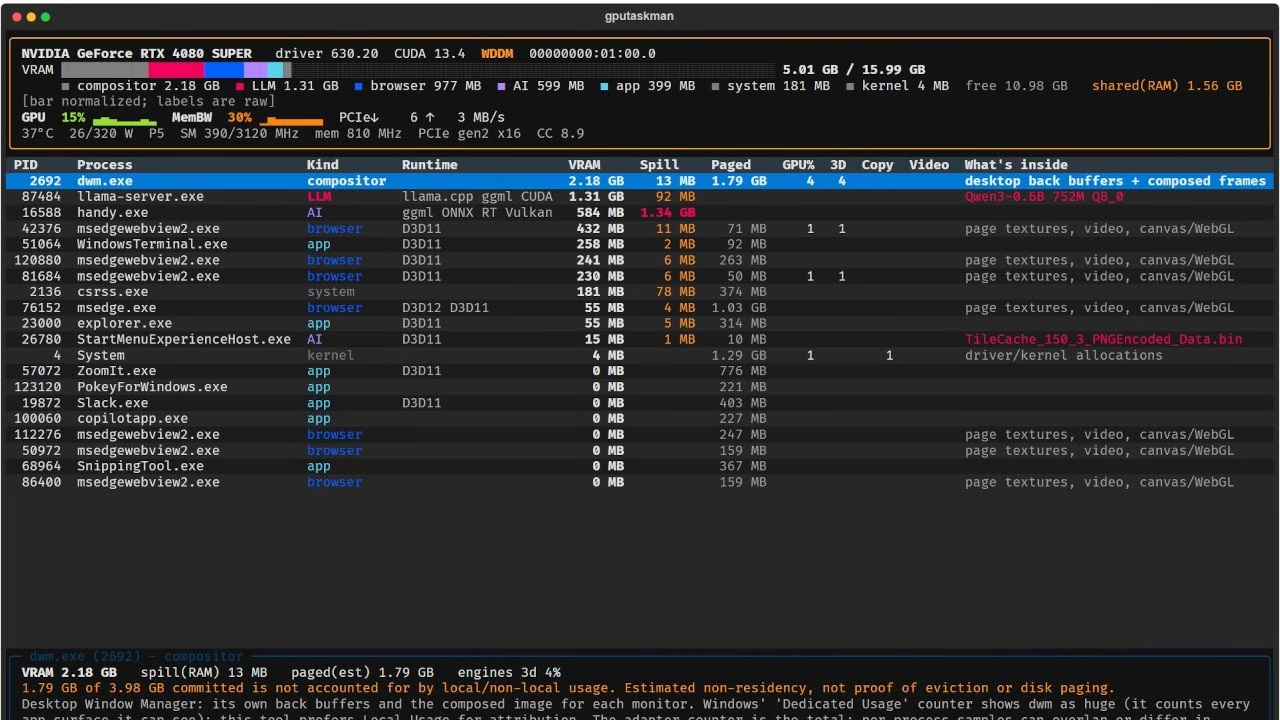
Scott Hanselman, a Microsoft executive and developer, has created gputaskman, an open-source project dedicated to monitoring GPU activity. The application is available for Windows, Linux, and macOS and displays video memory consumption, active processes, frequencies, and temperatures, with specific features for analyzing artificial intelligence models.
The Windows Task Manager is a widely used tool for controlling PC hardware resources and identifying processes that require the most memory or power. However, when it comes to GPUs, the available information is less detailed than that regarding the CPU. To fill this gap, Scott Hanselman, Vice President and Member of Technical Staff at Microsoft, developed gputaskman, an open-source project designed to provide an in-depth overview of what happens inside the GPU.
gputaskman: why it matters
The name intentionally evokes the Windows Task Manager, but the application focuses on graphics processing and hardware acceleration activities. The program is available for Windows, Linux, and macOS and presents information through a text-based interface in a terminal window. The idea behind the project stems from Hanselman’s personal need, which he explained on social networks: “A lot of things are happening on my GPU. I’m building a Task Manager for GPUs to understand where my graphics card memory is going.”
gputaskman allows users to observe various parameters, including GPU usage, operating frequencies, VRAM consumption, and temperatures. The most interesting feature is the ability to view resources used by individual processes, rather than just showing an overall value relative to the video card.
The interface is organized into three main sections. The top section collects GPU monitoring data, with charts that show in real time the trend of workload, video memory employed, and temperature. The middle part lists the processes utilizing the GPU, indicating for each one information such as runtime, VRAM consumption, and paging memory usage. Selecting one of the processes displays further details regarding the application in the bottom section. This organization makes it easier to identify which programs are occupying video memory.
In examples published by Hanselman, a system equipped with a GeForce RTX 4080 Super appears, where the process using the most VRAM is Desktop Window Manager, the Windows component responsible for composing and displaying graphical interface elements. The list also includes applications dedicated to artificial intelligence and other processes normally present in Windows.
What changes and what are the effects
Particular attention has been paid to workloads related to artificial intelligence and large language models (LLMs). gputaskman integrates a Model Inspector that allows users to obtain information about the AI models used by active processes. When selecting, for example, the llama-server.exe process, the program can show which language model is running and provide a breakdown of the resources employed. Among the available data are architecture, quantization, model weights, number of parameters, number of layers, and memory dedicated to the KV cache, a structure used during text generation to store intermediate information and reduce the need to repeat certain calculations. In the example shared by the developer, Qwen3-0.6B appears, a model with approximately 600 million parameters. The ability to distinguish consumption related to weights from that of the KV cache is particularly useful for those running AI models locally who want to understand how available video memory is distributed.
Compared to the Windows Task Manager, which already offers some information on GPU activity and the processes using it, gputaskman aims for a higher level of detail. Its approach may be especially interesting for more experienced users, those working with demanding graphical applications, and those simultaneously using multiple tools based on GPU acceleration.
The project is distributed under the MIT license, a permissive open-source license that allows the software to be used, modified, and redistributed in compliance with its conditions. The source code and technical information are available on GitHub, while Hanselman has also published executable packages for Windows. In addition to being a standalone monitoring tool, gputaskman highlights a gap in tools integrated into Windows. Responding to some comments on social media, Hanselman hinted that Windows might integrate more extensive GPU monitoring features in the future.
Source and further reading on gputaskman: original article.
* Content created with the assistance of artificial intelligence systems.